Bitcoin is back trading above the psychological $100,000 price level like it never left. After months of declines, the leading cryptocurrency has reclaimed $100,000 for the first time since January, and the crypto Fear and Greed Index is now back into the greed threshold.
Interestingly, this break above $100,000 also comes with the Bitcoin dominance above the 60% threshold. This is the first time Bitcoin dominance is breaking above $100,000 with such dominance over the market, which lends weight to the sustainability of the current rally.
Bitcoin Price Breaks $100,000 Again, But This Time The Market Looks Different
Bitcoin’s return above the $100,000 level has injected new energy into the broader crypto market, following several weeks of price stagnation and market hesitation. After enduring a drawn-out phase of correction and sideways movement, the leading cryptocurrency has now managed to clear several resistance zones in the past week, though a few more stand in the way before new all-time highs above $109,000 can be established.
It’s easy to assume that Spot Bitcoin ETFs are solely responsible for the current rally, but the data suggests otherwise. Inflows into these ETFs have averaged just $129 million over the past two days, which is a relatively small figure compared to the $700 million-plus inflows seen daily during Bitcoin’s last push past $100,000 in January. Rather than being powered by ETF activity alone, the current surge is a combination of macroeconomic developments and market-specific shifts that have converged over the past few weeks to support the upward price momentum.
A significant contributor to the improved sentiment is the U.S.-U.K. trade agreement announced on May 8, 2025. President Donald Trump and Prime Minister Keir Starmer introduced a new deal that keeps the 10% U.S. tariff on British imports intact while the U.K. lowers its own tariffs to 1.8% and expands access to American goods. This agreement has cooled what had been growing investor anxiety. The fear of escalating tariffs had previously helped push Bitcoin down to a low of $74,000 in early April. Now, with tensions easing, capital is flowing back into risk assets, giving Bitcoin an added push at a crucial moment.
Is BTC’s Rally Above $100,000 Sustainable?
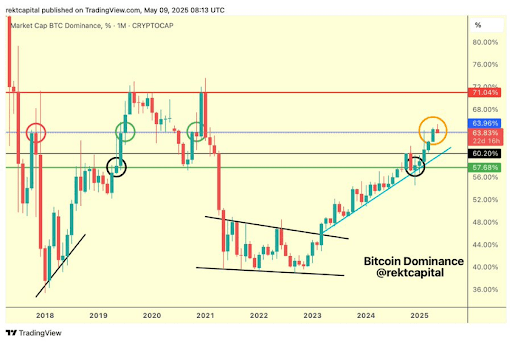
Compared to previous surges past six figures, this rally is unfolding under notably different market conditions. One of the clearest differences is Bitcoin’s dominance, which now sits above 60%.
This level of dominance points to a stronger structural support beneath the price action. As noted by crypto analyst Rekt Capital, there’s a possibility that the Bitcoin dominance will continue to 71% over time.
On-chain data further strengthens the case for the sustainability of the current rally. Exchange balances have been declining for a while, which has contributed to the current uptrend. This trend is matched by stablecoin inflows into exchanges, which typically precede buying activity.
At the time of writing, Bitcoin is trading at $102,900, with an intraday high of $103,890. This puts it at 5.7% way from reclaiming its January all-time high of $108,780. According to glassnode data, about 3 million BTC have returned to a state of profit between April’s low of $74,000 and the current price action.

Featured image from Pixabay, chart from Tradingview.com

Editorial Process for bitcoinist is centered on delivering thoroughly researched, accurate, and unbiased content. We uphold strict sourcing standards, and each page undergoes diligent review by our team of top technology experts and seasoned editors. This process ensures the integrity, relevance, and value of our content for our readers.