The best traders don’t just trade; they continuously analyse historical data to sharpen their trading performance.
Understanding the need for users to have a clear, accurate, and truly comprehensive view of their trading, our PnL Dashboard is a one-stop tool for you to analyse your portfolio’s true profitability and performance.
Alongside total PnL (Profit and Loss), you can also access fees spent, funding paid/received, and margin balance.
This feature is found under Wallets > Trading Performance which provides an intuitive way to view, analyse, and understand your trading results.
Check your trading performance here.
What the PnL Dashboard Offers
We believe in clear visibility, unlike other exchanges that often obscure fees. Your PnL Dashboard gives you a transparent view of your trading performance, so you can identify opportunities and boost your success.
- Comprehensive Performance Metrics: Go beyond simple PnL. Get a transparent breakdown of every factor affecting your profitability, from Fees and Funding to Asset and Margin Balance.
- Actionable Visual Insights: Dive deep into your trading history with intuitive charts and tables. Easily identify performance patterns and trends across various timeframes, from 1D, 1W, 1M, 1Q, Year-to-Date (YTD), and up to 365 days of historical data.
- Data Accessibility for Power Users: For those craving deeper analyses, a data export function is readily available. Additionally, VIP users can receive an AI-powered trading report that provides trading behaviour analyses and actionable insights.
Learn more about our VIP Trading Reports here.
How the PnL Dashboard Works
1. Accessing your Dashboard
Navigate to the PnL Dashboard via Wallets > Trading Performance.
If you haven’t signed up for a BitMEX account yet, we’re currently offering $5,000 worth of BMEX Tokens to new users – you can register here.
2. Comprehensive Overview
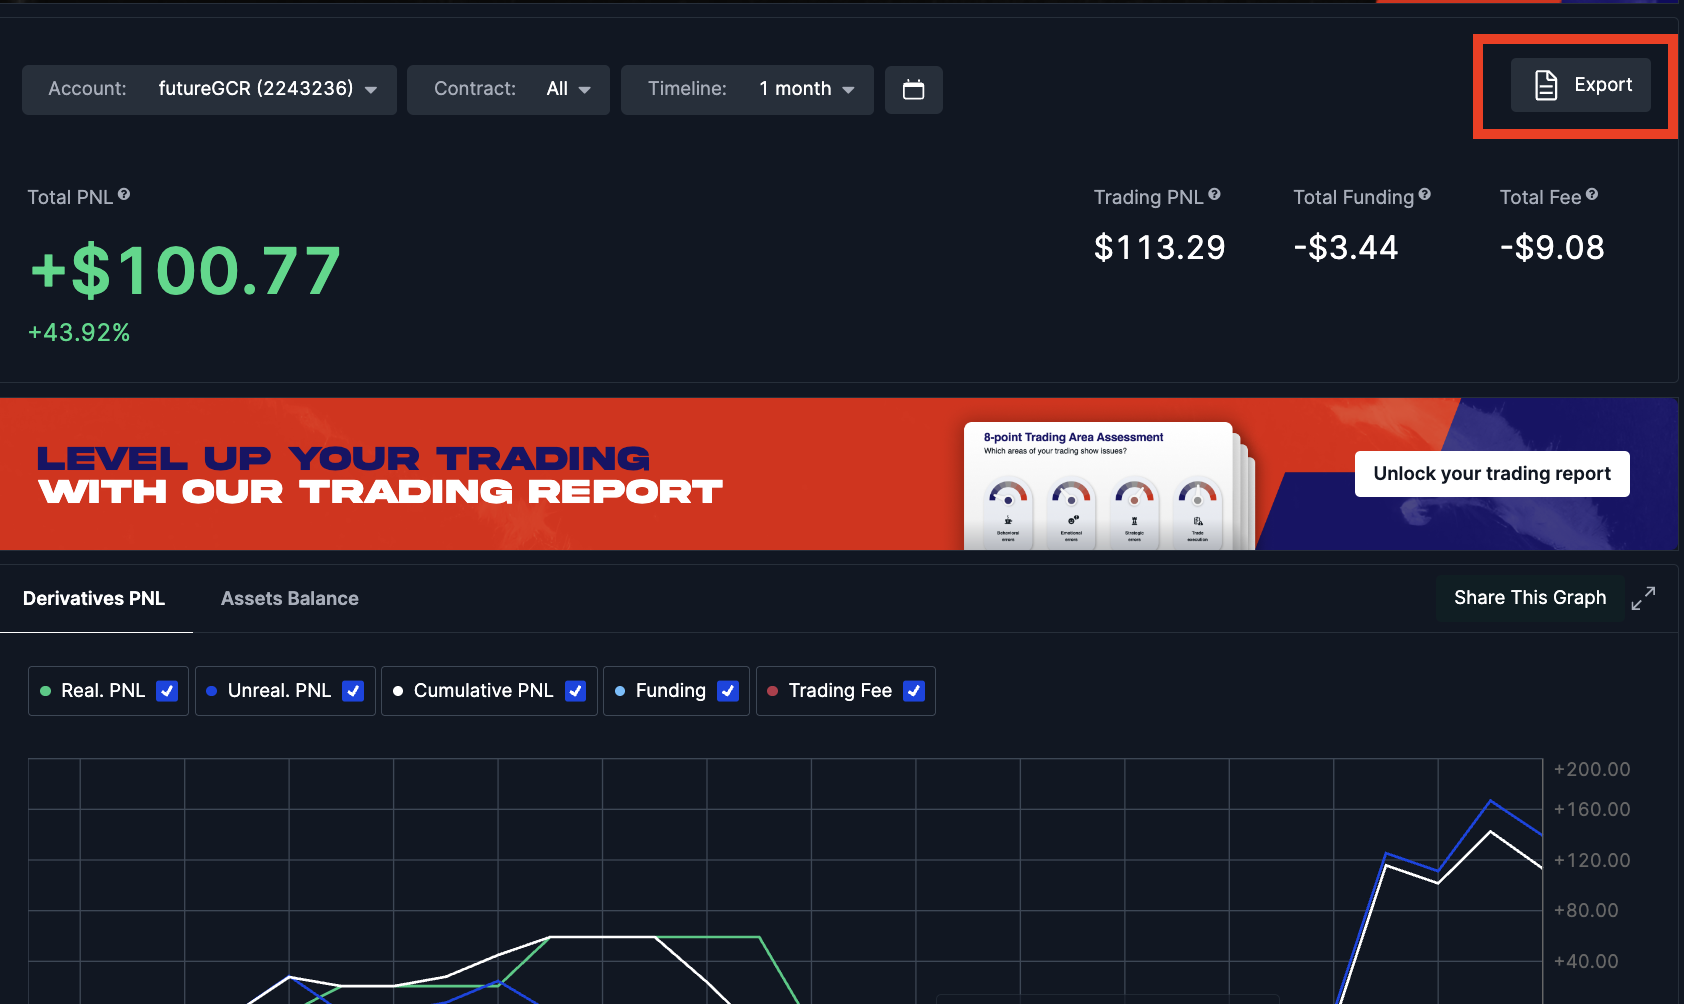
The dashboard defaults to a consolidated view of your main account and all Sub Accounts, presented clearly in both graph and table form.
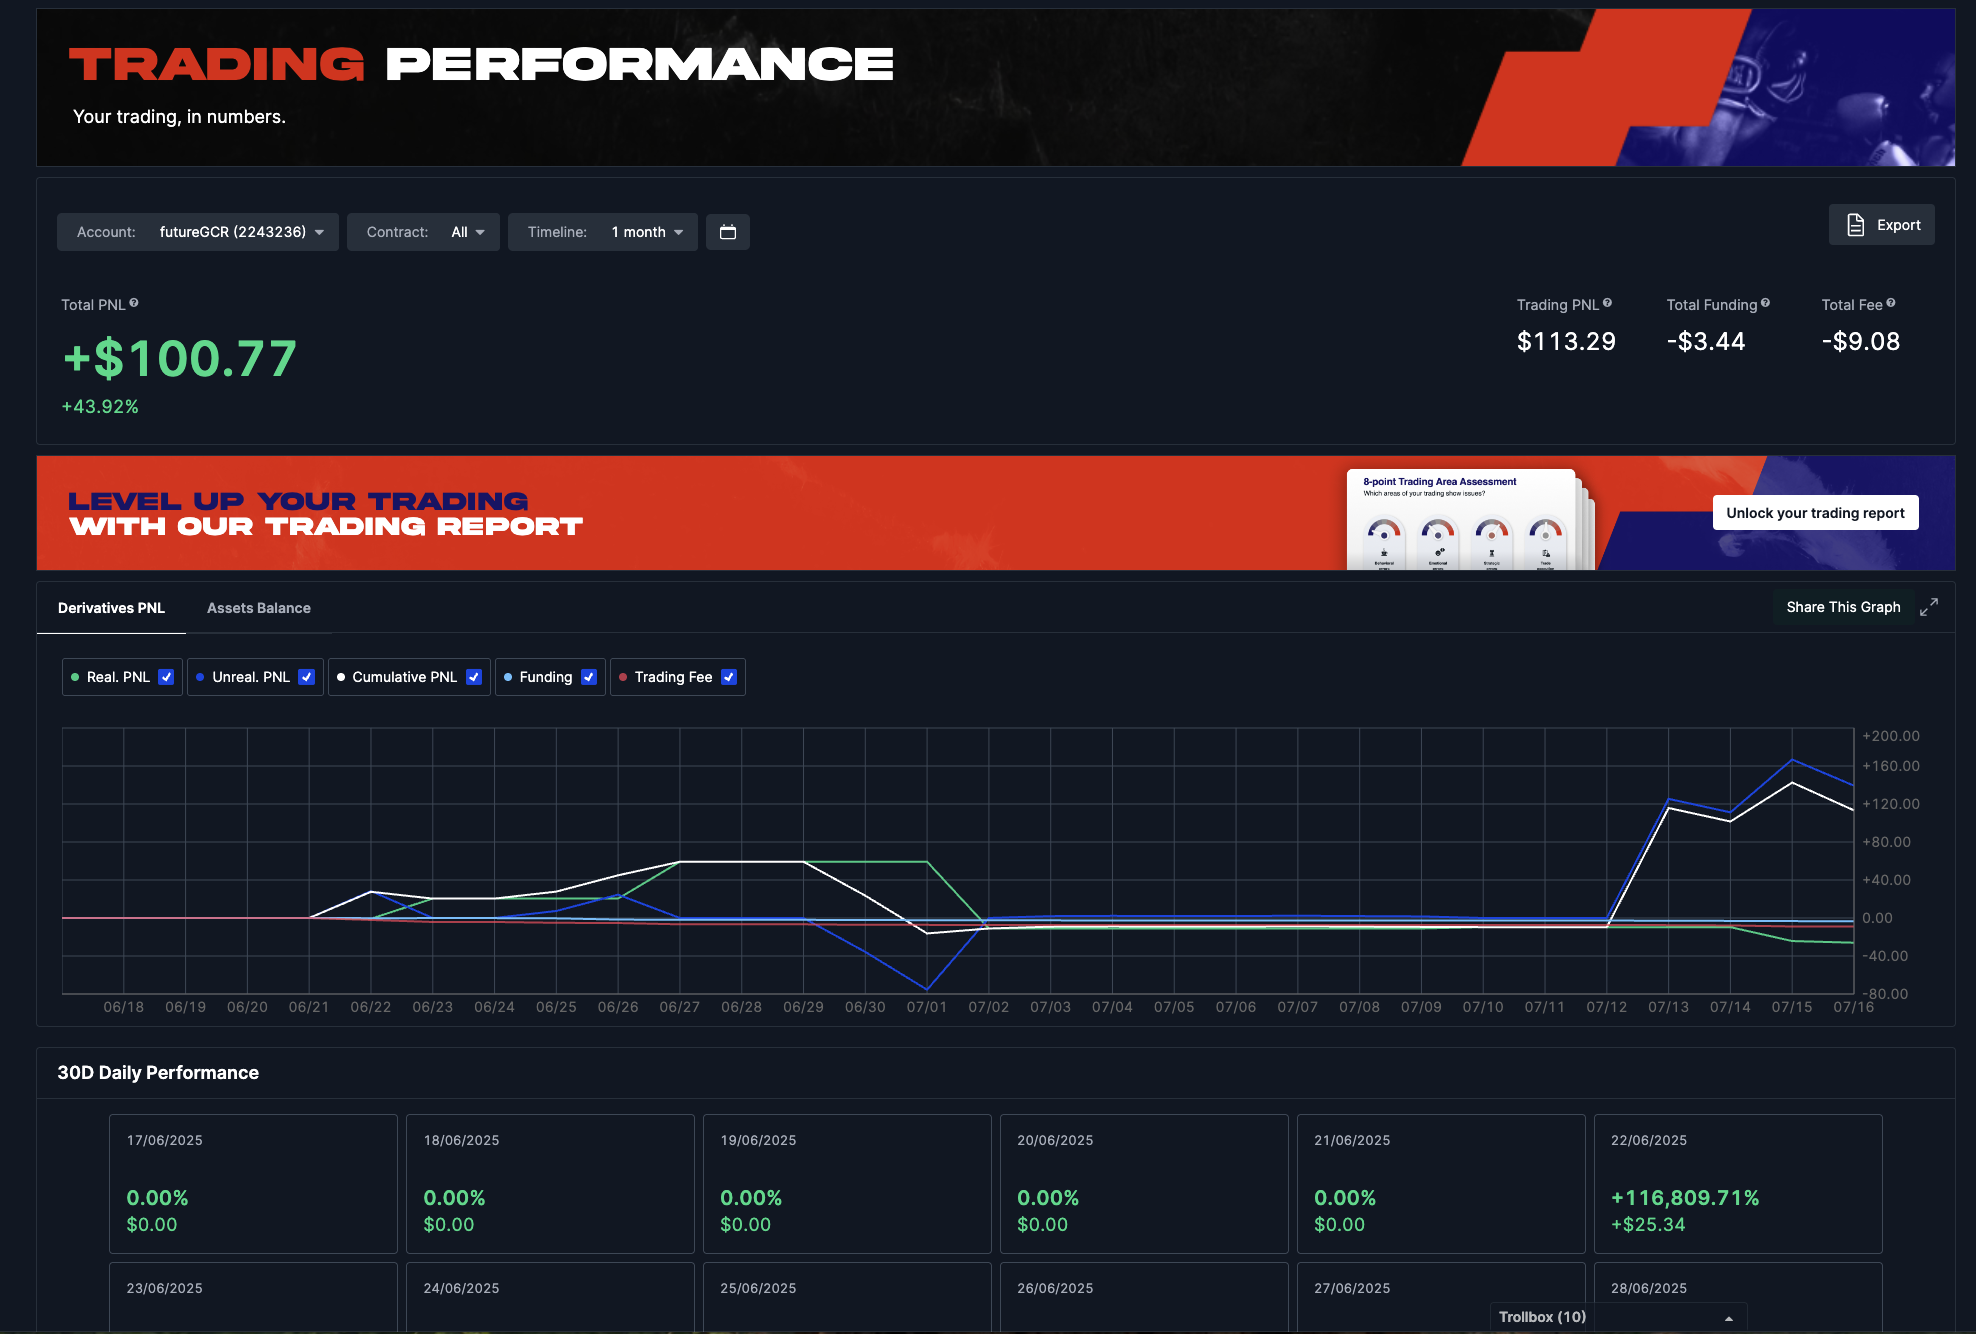
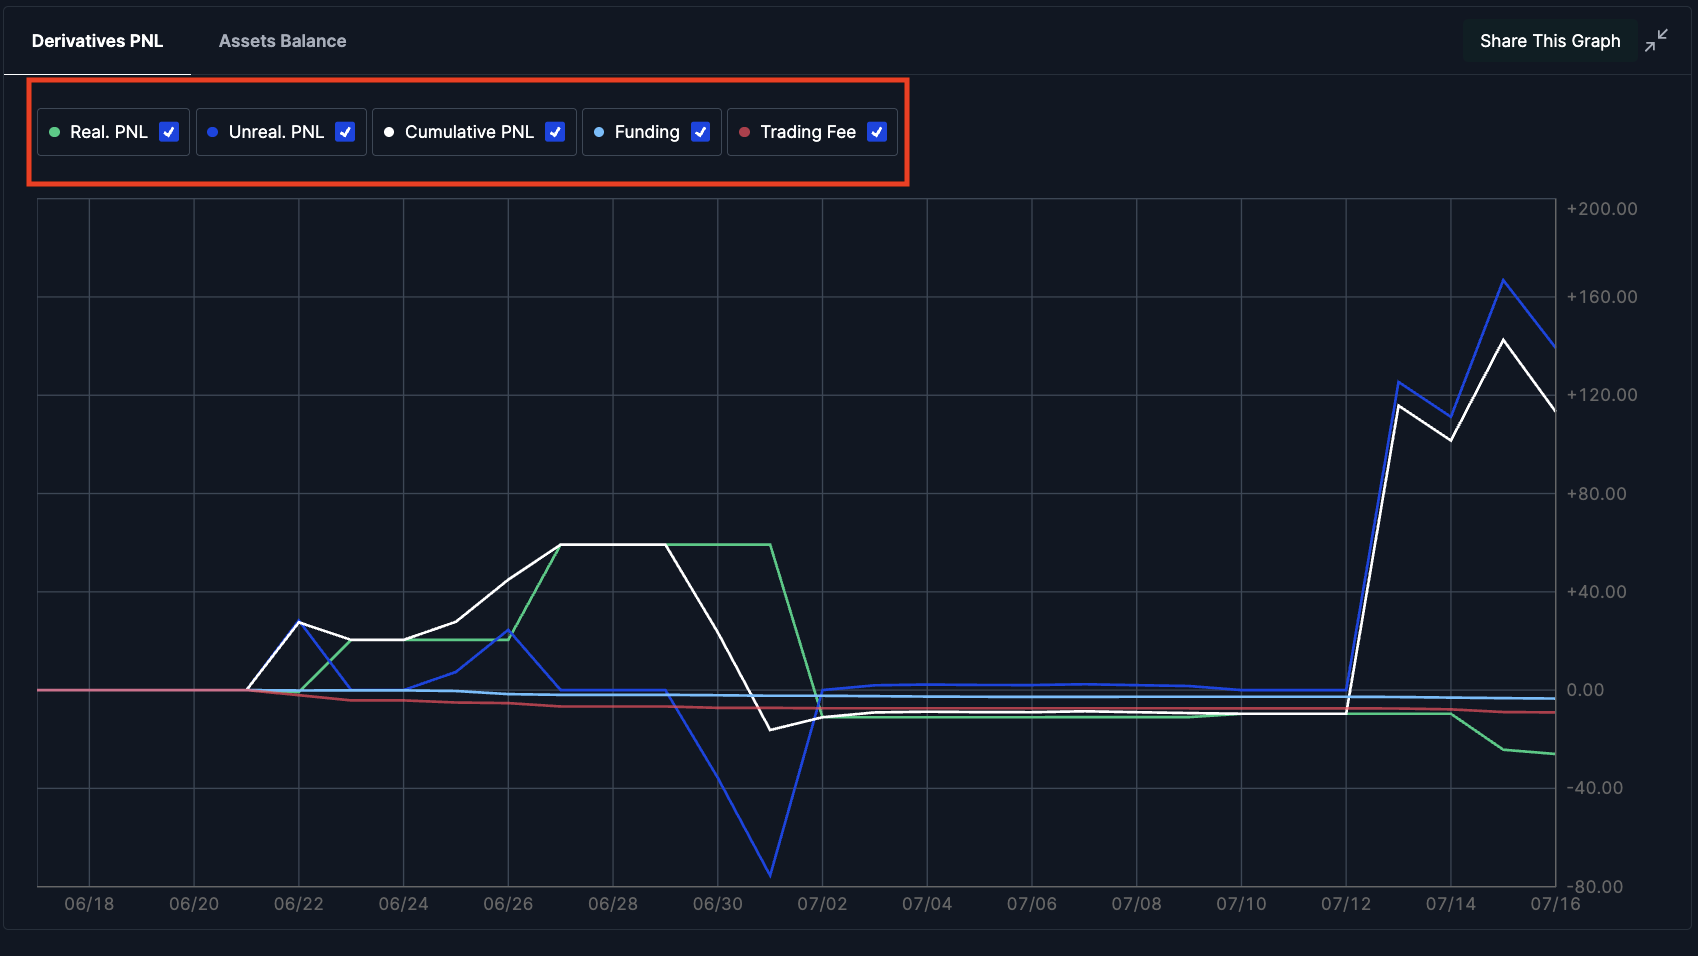
3. PnL Breakdown
Track essential data points like Cumulative PnL (Amount & %), Trading Volume, and Funding Fees, each customisable with a simple toggle.
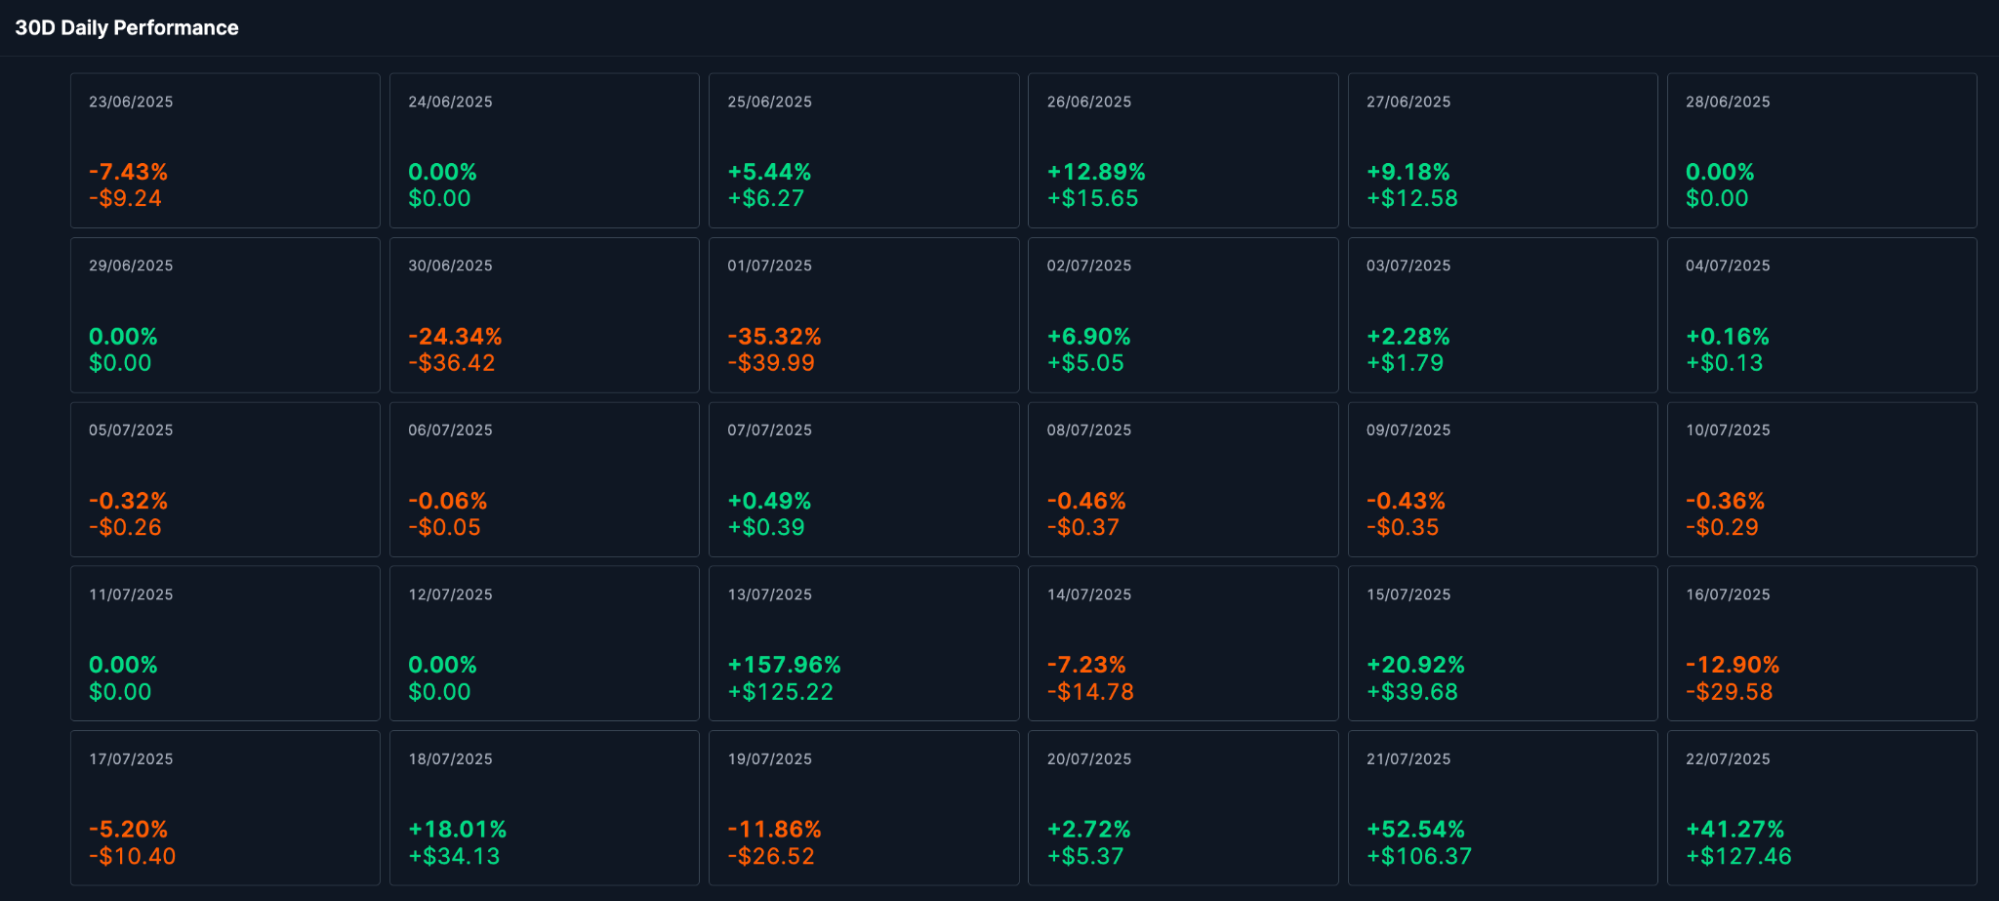
4. Performance Snapshot
Performance is visualised through a table showing daily PnL and ROI over 30 days.
5. Timeframe Control
Easily filter data using predefined timeframe buttons (1D, 1W, 1M, 1Q, YTD) or a custom date range selector.
6. Filter by Account
You can filter the view to see the performance of a single account instead of the consolidated view.
7. Filter by Contract
Select individual contracts you traded to get a detailed breakdown of performance for each.
8. Data Export
For more in-depth analysis, click the “Export” button to download your filtered data as a CSV file.
How to Use the PnL Dashboard to Improve Your Trading
The PnL Dashboard isn’t just about viewing data; it’s a powerful tool to refine your trading strategy and boost your success. Here’s how you can leverage it:
|
Method |
Description |
Example |
|
Identify Costly Habits |
Identify if fees from strategies, pairs or high-frequency trades erode profit. |
Your PnL shows significant daily fees from your high-frequency strategy, revealing these costs are eroding profits and prompting you to adjust trade frequency or holding times. |
|
Optimise Position Management |
Unrealised PnL is a strong indicator of your position management effectiveness. Analyse it to see if you’re holding onto losing positions too long or round-tripping gains too often. |
You notice unrealised gains bleeding over weekends, revealing low-volume, high-volatility holding risks. This prompts you to adjust your exit strategy and close positions before weekends. |
|
Timeframe Strategies |
Use the custom timeframes (1D, 1W, 1M, YTD) to identify which strategies perform best over different periods. |
Your scalping strategy yields higher return on the daily, whilst your swing strategy performs better on the monthly. |
|
Learn from History |
Identify recurring patterns in your trading performance. Did certain market conditions lead to more gains or losses? |
You find consistent high ROI on long positions during October (‘Uptober’) in previous years, suggesting you increase your early exposure for the month. |
|
Identify your Pair Preference |
Your trading strategy performs differently across pairs. Identify your most profitable pairs and reallocate capital from underperformers. |
Your reversal strategy profits consistently on PENGUUSDT but fails on WIFUSDT, pointing to PENGUUSDT as the better focus and momentum. |
Ready to gain unparalleled insight into your trading performance? Explore the PnL Dashboard today and make more informed trading decisions here.
For the full details on the PnL Dashboard, head over to the FAQs page here.
To be the first to know about our new promotions, giveaways, listings, and product launches, you can visit https://www.bitmex.com/ or connect with us on Telegram,Twitter, and Discord. We encourage you to also check our blog regularly.
In the meantime, if you have any questions please contact Support.